When people admire the breathtaking images of distant galaxies released by modern space telescopes, they often imagine giant cameras floating silently in space, capturing colorful photographs of the cosmos. In reality, what telescopes collect is far less glamorous at first glance—streams of scientific data, monochrome measurements of light, and enormous datasets that are incomprehensible without careful interpretation.
Between the telescope and the final image stands a remarkable group of specialists whose work rarely receives public attention. They are astronomers, data visualization experts, image-processing scientists, software engineers, and scientific communicators who transform raw observations into the stunning cosmic portraits that inspire millions of people around the world.
Without their expertise, many of humanity’s greatest astronomical discoveries would remain hidden inside spreadsheets of numbers and grayscale detector readings. Their work bridges the gap between science and human perception, turning invisible wavelengths of light into maps of the Universe that both researchers and the public can understand.
In modern astronomy, seeing the Universe is as much about interpreting data as it is about collecting it.
Telescopes Don’t Take Photographs—They Collect Data
One of the biggest misconceptions about space telescopes is that they function like ordinary cameras.
Unlike consumer cameras, astronomical instruments are scientific detectors designed to measure light with extraordinary precision. Depending on their mission, telescopes may observe:
- Visible light
- Infrared radiation
- Ultraviolet light
- X-rays
- Radio waves
- Gamma rays
Every observation produces raw scientific data rather than a ready-to-publish image.
A telescope records information such as:
- Light intensity
- Wavelength
- Exposure duration
- Spatial coordinates
- Instrument calibration values
Before anyone can admire a colorful nebula or a spiral galaxy, scientists must first understand what these measurements actually represent.
The Universe arrives as data long before it becomes an image.
The Birth of Scientific Visualization
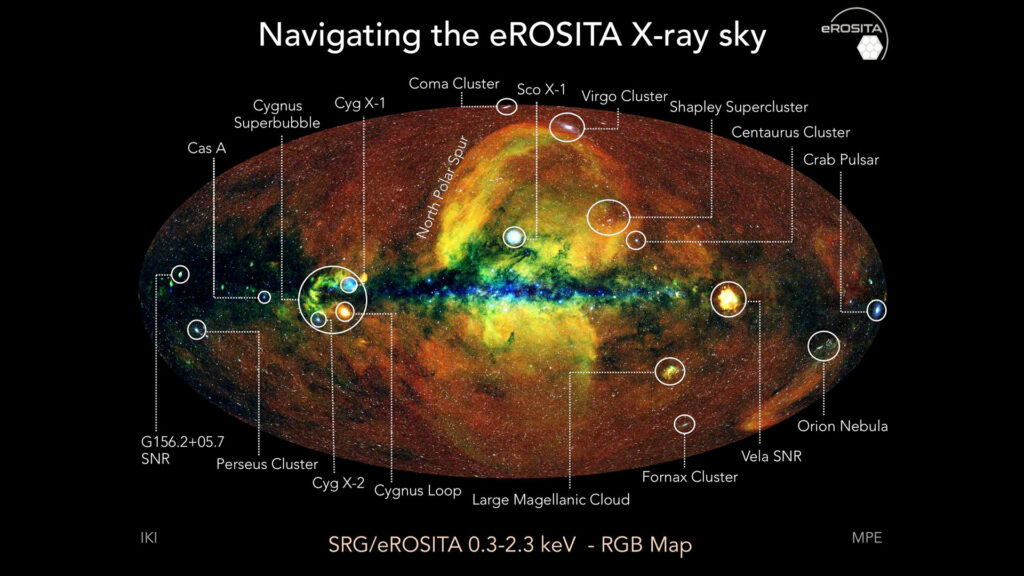
Scientific visualization is the process of transforming complex datasets into visual representations that preserve scientific accuracy while making information understandable to human observers.
In astronomy, visualization specialists answer important questions such as:
- Which wavelengths should be displayed?
- How should invisible light be represented?
- What colors best communicate physical processes?
- Which structures should be emphasized?
- How can multiple observations be combined without losing scientific meaning?
The goal is not artistic embellishment but effective communication.
A modern astronomical image is often the product of dozens—or even hundreds—of individual observations collected over many hours or days. Scientists combine these datasets to create visualizations that reveal the underlying physics of celestial objects.
Scientific visualization has become one of the most important disciplines in twenty-first-century astronomy.
Who Are the People Behind the Images?
Creating astronomical images is an interdisciplinary effort involving experts from numerous fields.
Astronomers
Astronomers design scientific observations and determine which celestial objects should be studied.
They ask questions such as:
- What physical processes are occurring?
- Which wavelengths are most useful?
- What scientific discoveries are possible?
Data Scientists
Modern telescopes generate enormous quantities of data. Data scientists develop algorithms capable of processing:
- Large datasets
- Calibration procedures
- Noise reduction techniques
- Automated image analysis
Their work is particularly important for space observatories that continuously transmit information back to Earth.
Image Processing Specialists
These experts transform calibrated datasets into scientifically meaningful visual representations.
They determine:
- Color assignments
- Contrast levels
- Image composition
- Feature enhancement techniques
Many iconic astronomical images owe their visual impact to the careful decisions made during this stage.
Software Engineers
Modern astronomy relies heavily on sophisticated software.
Engineers create tools capable of:
- Aligning observations
- Processing raw telescope data
- Performing image reconstruction
- Supporting scientific analysis
Without advanced computational techniques, many modern astronomical discoveries would be impossible.
Science Communicators
Finally, educators and communicators help explain what the images reveal about the Universe.
Their work ensures that complex scientific discoveries remain accessible to students, teachers, and the general public.
Together, these specialists form the invisible teams behind humanity’s most famous views of the cosmos.
Turning Numbers into Cosmic Landscapes
Raw telescope data rarely resembles the spectacular images published by scientific institutions.
Scientists must first perform extensive calibration procedures to remove:
- Detector noise
- Instrument artifacts
- Cosmic ray contamination
- Optical distortions
- Background signals
Once calibrated, multiple observations are combined into a single dataset.
For example, an image of a nebula may include:
- Visible-light observations
- Infrared measurements
- Narrowband filter exposures
- Long-exposure data collected over several hours
Visualization experts then assign colors that correspond to physical properties observed within the data.
The resulting image becomes a scientifically meaningful map of the object being studied.
Every color tells a story about temperature, composition, or energetic processes occurring within the Universe.
Why Colors in Space Images Are Scientifically Important
Many people are surprised to learn that some of the most famous astronomical images use colors that are invisible to the human eye.
This is particularly true for observations captured in:
- Infrared wavelengths
- X-rays
- Ultraviolet light
- Radio astronomy
Scientists use color to communicate information rather than simply reproduce what human vision would perceive.
Color choices may reveal:
- Chemical composition
- Temperature variations
- Dust distribution
- Star-forming regions
- High-energy events
- Relative wavelengths of light
A blue region within a nebula might indicate hotter gas, while a reddish structure could reveal cooler dust or longer infrared wavelengths.
In scientific visualization, color is a language rather than a cosmetic enhancement.
The James Webb Space Telescope: A Visualization Challenge
The James Webb Space Telescope provides one of the most impressive examples of modern astronomical visualization.
Webb observes primarily in infrared light—a region of the electromagnetic spectrum invisible to humans.
When its instruments capture observations, scientists receive monochrome datasets corresponding to different infrared wavelengths.
Transforming these observations into published images requires:
- Calibration
- Data alignment
- Noise correction
- Color assignment
- Dynamic range adjustments
- Scientific review
Each image released by Webb represents the collaborative efforts of engineers, astronomers, and visualization specialists.
Far from being “Photoshopped pictures of space,” Webb’s images are carefully constructed scientific translations of infrared observations collected billions of light-years from Earth.
Mapping the Universe Beyond Human Vision
Scientific visualization has expanded humanity’s ability to explore regions of the Universe that would otherwise remain inaccessible.
Today, astronomers routinely create maps of:
- Dark molecular clouds
- Stellar nurseries
- Galactic collisions
- Black hole environments
- Cosmic dust distributions
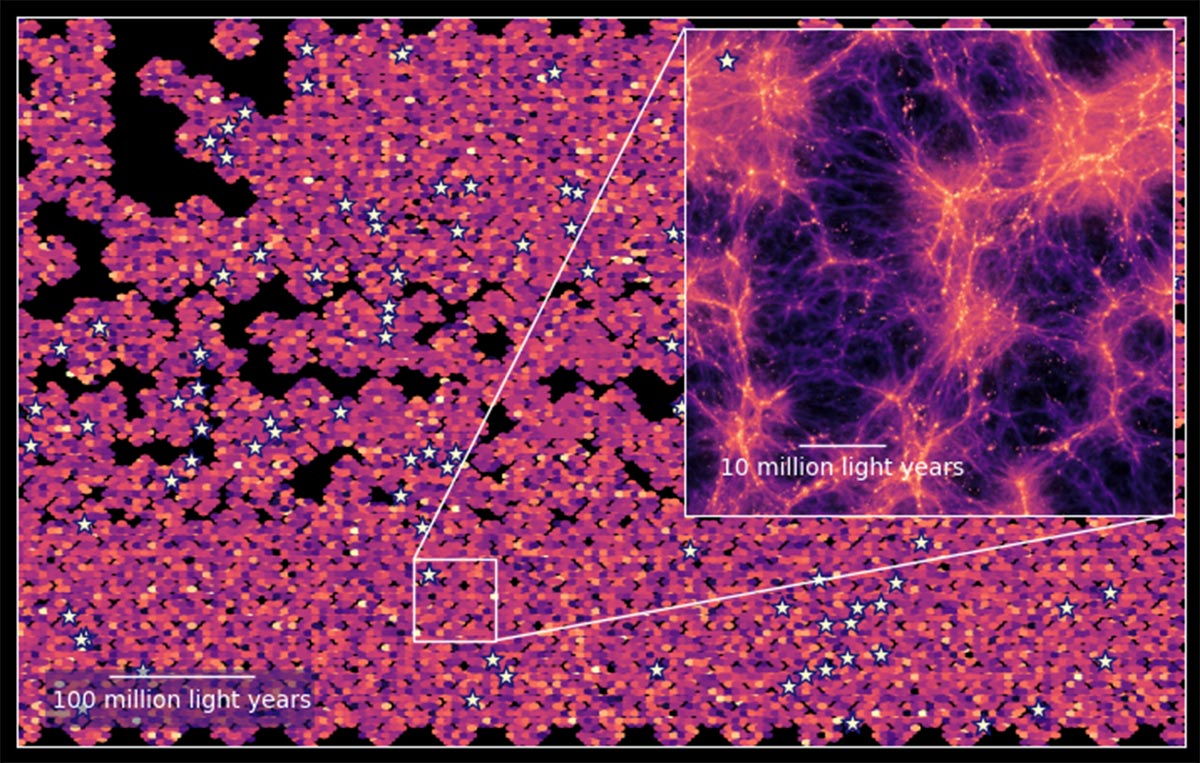
- Large-scale structures of the Universe
Some astronomical datasets contain information collected across multiple wavelengths simultaneously.
Combining these observations allows scientists to construct multidimensional views of celestial objects.
Modern astronomy increasingly depends upon our ability to visualize complex information rather than merely observe it directly.
In many cases, discoveries occur not when telescopes gather data, but when scientists learn how to interpret and represent that data effectively.
The Growing Role of Artificial Intelligence
Artificial intelligence is becoming an increasingly valuable tool in astronomical image analysis.
AI technologies assist scientists by:
- Identifying unusual astronomical objects
- Removing observational noise
- Classifying galaxies
- Detecting transient events
- Processing enormous datasets efficiently
Upcoming observatories are expected to generate petabytes of scientific data each year—far more than human researchers can manually analyze.
Artificial intelligence will not replace astronomers or visualization experts, but it will significantly enhance their capabilities.
Future astronomical imagery will likely emerge from collaborations between scientists and intelligent computational systems.
Scientific Images Inspire Scientific Discovery
Astronomical images serve purposes that extend far beyond public outreach.
Visualization techniques help scientists:
- Identify previously unseen structures
- Compare observational models
- Analyze physical processes
- Communicate discoveries across disciplines
Some of the most significant astronomical discoveries of recent decades were made possible because researchers developed new ways of interpreting observational data.
Images do more than illustrate scientific findings—they actively contribute to them.
The relationship between visualization and discovery continues to grow as telescopes become increasingly sophisticated.
Careers in Astronomical Visualization
Many students interested in astronomy are surprised to learn that scientific visualization represents an exciting and growing career path.
Professionals in this field often possess expertise in:
- Astronomy
- Physics
- Computer science
- Data science
- Digital imaging
- Graphic design
- Science communication
Institutions involved in major astronomical missions regularly employ specialists responsible for transforming scientific observations into both research tools and public-facing imagery.
These careers demonstrate that modern space exploration requires far more than astronauts and rocket scientists. It also depends on individuals capable of helping humanity understand what our instruments are revealing about the cosmos.
Conclusion
The spectacular images produced by modern telescopes are the result of far more than advanced hardware orbiting high above Earth. Behind every published image lies the expertise of scientists, engineers, and visualization specialists who carefully transform raw measurements of light into meaningful representations of the Universe.
Their work allows us to see beyond the limits of human vision, revealing hidden stars, distant galaxies, and the fundamental processes that shape cosmic evolution. They are the interpreters of astronomical data—the people who convert billions of photons traveling across space into images that educate, inspire, and expand our understanding of reality.
In the age of big data astronomy, discovering the Universe increasingly depends not only on where we look, but also on how we learn to visualize what we find. Every iconic space image is therefore more than a photograph—it is a collaborative scientific achievement that brings the cosmos within reach of human imagination.
FAQ
Do space telescopes take ordinary photographs?
No. Space telescopes collect scientific measurements of light across various wavelengths, which are later processed into visual representations.
Who creates astronomical images?
Astronomers, data scientists, image-processing specialists, software engineers, and science communicators all contribute to creating modern astronomical imagery.
Why are colors assigned to telescope images?
Colors help represent physical properties such as temperature, chemical composition, and wavelength information that may otherwise be invisible to human eyes.
Are telescope images scientifically accurate?
Yes. Although they undergo processing and color assignment, astronomical images are based entirely on real observational data and are carefully reviewed for scientific accuracy.
Can scientific visualization lead to discoveries?
Absolutely. Visualization techniques often reveal structures and relationships within astronomical data that contribute directly to scientific research and new discoveries.